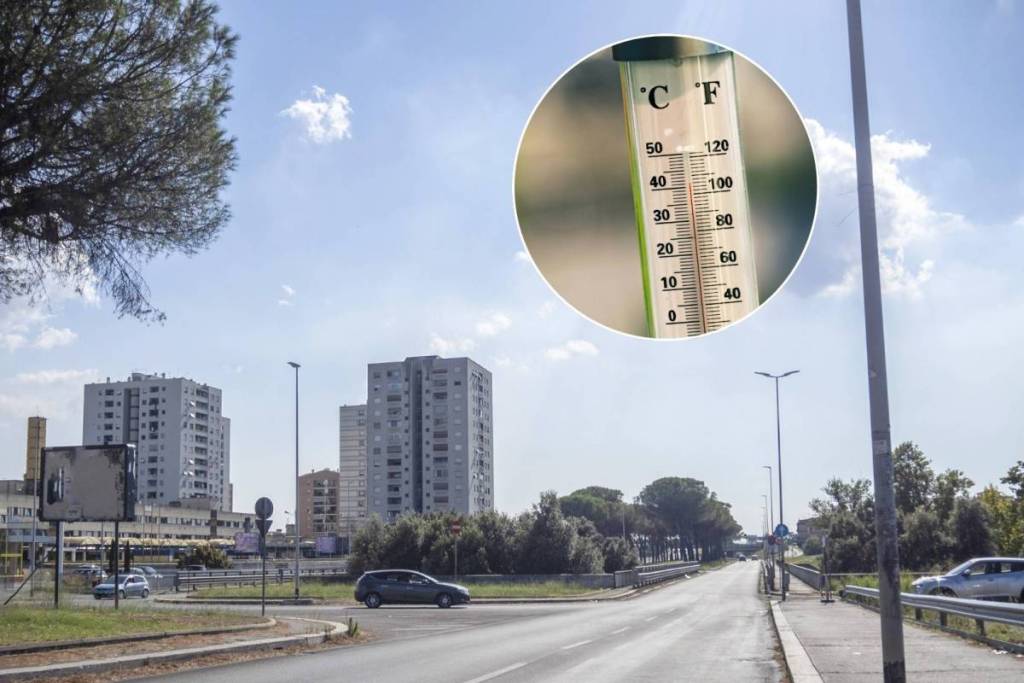

During the second summer heat wave of July 2026, Rome exhibited a deeply uneven thermal landscape. On the same day, the temperature difference between one neighborhood and another exceeded five degrees, and the heat map changes radically between daytime and nighttime hours. This is what emerges from the analysis conducted by Keti Lelo, Salvatore Monni, and Federico Tomassi for #mapparoma, based on data from the MODIS (Moderate Resolution Imaging Spectroradiometer) sensor aboard NASA’s Terra satellite, which provides daily surface temperature measurements with a spatial resolution of approximately 1 km.
The eastern suburbs sizzle during the day, while the city center doesn’t cool down at night
The peak average daytime temperature was recorded on July 18, 2026, with an average of 35.6 °C across the entire city, while the absolute maximum— 37.9 °C —was reached on July 19 in Casetta Mistica. The eastern quadrant was the hardest hit during daylight hours: Casetta Mistica (37.5 °C), Torre Maura, Torre Angela, Tor Tre Teste, and Romanina (37.3 °C) topped the list of the hottest urban areas. The 5th Municipality neared an average daytime temperature of 37 °C, while the 6th exceeded 36.5 °C. In contrast, rural and coastal areas such as Martignano (30.8 °C), Castel Fusano (31.4 °C), and Ostia Sud (32.1 °C) recorded significantly lower temperatures.
Night turns the rankings upside down. As darkness falls, the heat leaves the eastern suburbs but remains trapped in the dense, historic neighborhoods: Università, Casal Bertone, and Verano record 28.7 °C; San Lorenzo and Nomentano, 28.6 °C; while Castel Romano drops to 23.2 °C. The difference between the hottest and coolest neighborhoods on the same night exceeds five degrees. The mechanism is structural: soil sealing and the high building density in the city center trap the heat accumulated during the day, slowing down nighttime cooling.
The heat island index: the impact of built-up areas
The analysis also calculatesthe Urban Heat Island Intensity Index (UHII), measured as the difference relative to the rural reference station in Fiumicino. During the day, Casetta Mistica exceeds Fiumicino by nearly 4.5 °C; at night, Università and Casal Bertone exceed the reference station by over 3.2 °C. The strongest correlation with the nighttime UHII is with land use (coefficient 0.79), followed by population density (0.67) and the proportion of elderly residents (0.53): in more impervious areas, heat dissipates more slowly, and the most vulnerable segments of the population—the elderly, the sick, and children—are often concentrated precisely in these areas.
Heat and Income: Overlapping Geographies
Cross-referencing climate data with socioeconomic data reveals a troubling picture for the eastern quadrant. In 2024, Tor Bella Monaca-Torre Angela recorded an average income per taxpayer of about 21,700 euros, compared to 78,500 in Parioli. In 2022,8% of households in the same area received the Citizenship Income. These same neighborhoods are among those most exposed to extreme daytime temperatures. The cost of air conditioning, energy efficiency, and electricity bills thus risks turning the heat into yet another factor contributing to energy poverty.
The analysis through the “Seven Romes” confirms that climatic geography and economic geography do not perfectly align: the historic city is among the wealthiest but also has the largest nighttime heat island (+2.8 °C), while the city-countryside—which is economically more fragile—is climatically cooler at night (−0.9 °C compared to Fiumicino). According to the authors, identifying the areas where climate and economic vulnerability overlap remains one of the central challenges of urban adaptation policies: more trees, permeable surfaces, and greater energy efficiency in buildings in the most vulnerable areas are the recommended strategies for reducing heat-related inequalities. Dynamic maps and open data are available on the mapparoma website.